When you’re running a small business, you need to know what’s working and what’s not. That’s where dashboards and reports come in. They turn your raw data into something you can actually use to make decisions. Whether it’s tracking sales, measuring your team’s progress, or keeping an eye on marketing efforts, having visibility is key.
The best part? Bigin gives you access to powerful dashboards even though it’s built for small businesses. So, you get the kind of insights usually reserved for large-scale CRMs—without the complexity or cost.
Before setting up dashboards in Bigin, make sure you’ve already:
- Customized your fields and modules
- Created pipelines that match your process
- Imported your existing data
- Set up any needed integrations and automations
Need help with setup? Read our blog on 6 easy steps to get set up with Bigin in less than 30 minutes.
Why Bigin’s Dashboard is a Big Win for Small Business
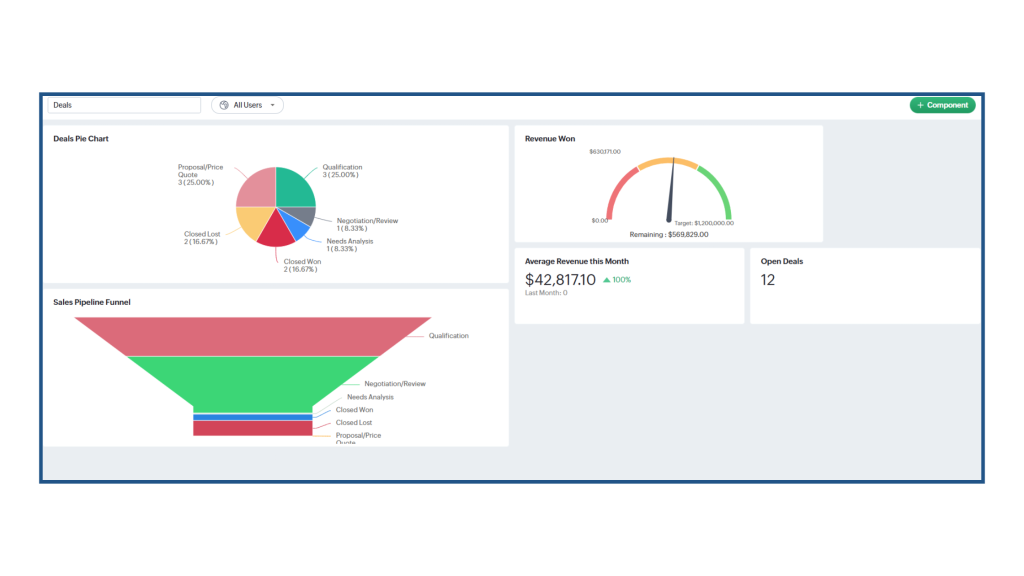
The dashboard in Bigin gives you a real-time look at how your business is doing. With different components like charts, KPIs, and target meters, you can track performance across sales, marketing, customer engagement, and more.
You can build private dashboards just for yourself or share them with your team. You can also customize exactly what you want to measure and how it looks. It’s fast, visual, and designed to help you take action.
How to Set Up a Custom Dashboard in Bigin
Setting up your first dashboard in Bigin is easy. Here’s how:
- Click on the Dashboards tab
- From the dropdown, click + New Dashboard
- Name your dashboard
- Choose who can see it:
- Only Me (private)
- All Users
- Custom (select specific users, roles, or groups)
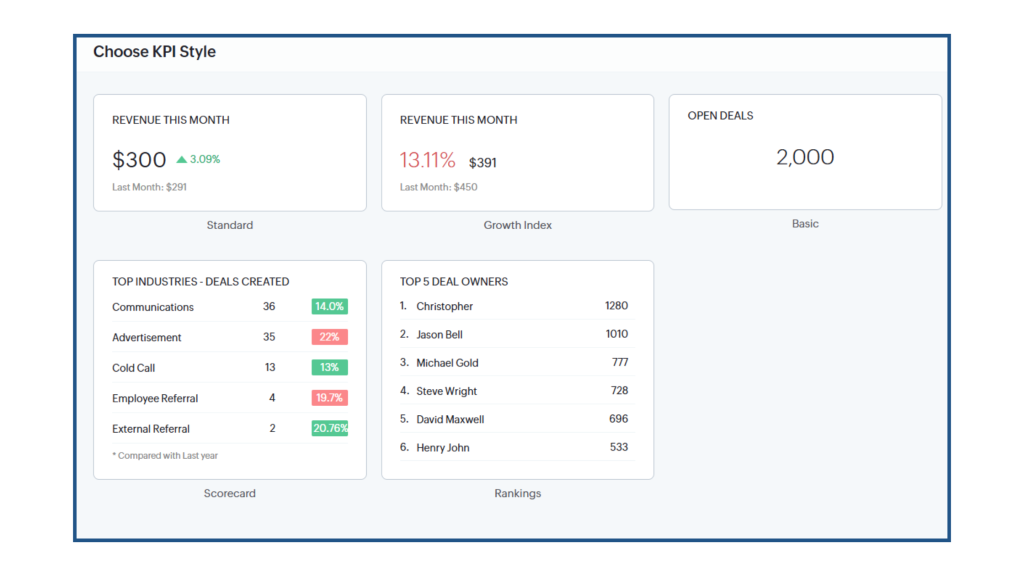
- Click + Component to start adding visuals like charts, KPIs, or target meters
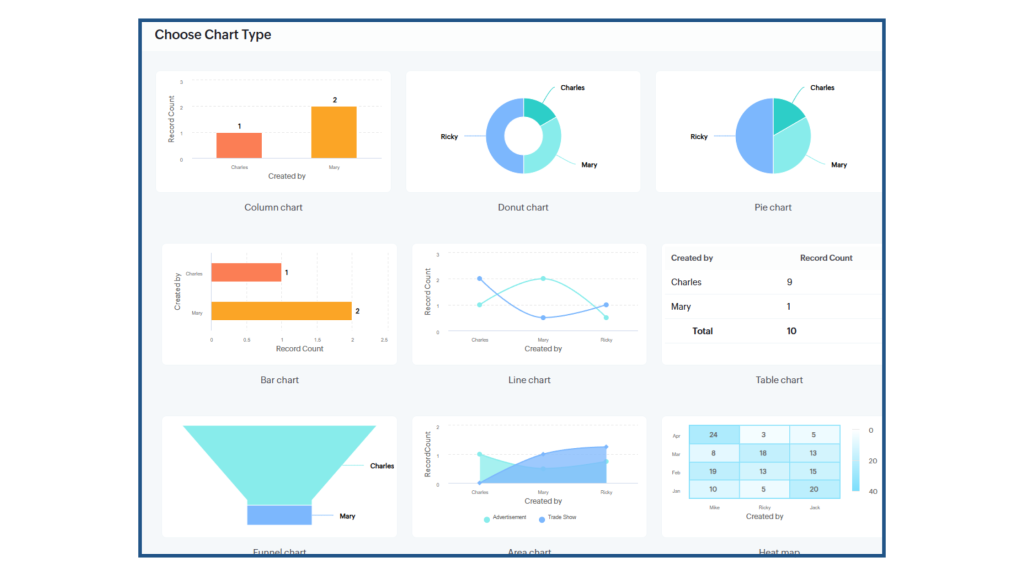
- For a chart, select the type you want (bar, pie, funnel, etc.)
- Choose the data source, apply filters, and customize your layout
- Click Save
Example:
Let’s say you want to track the amount in each stage of your sales pipeline.
You could add a funnel chart to your dashboard and set it up like this:
- Module: Sales Pipeline
- Measure: Sum of Amount
- Groupings: Stage
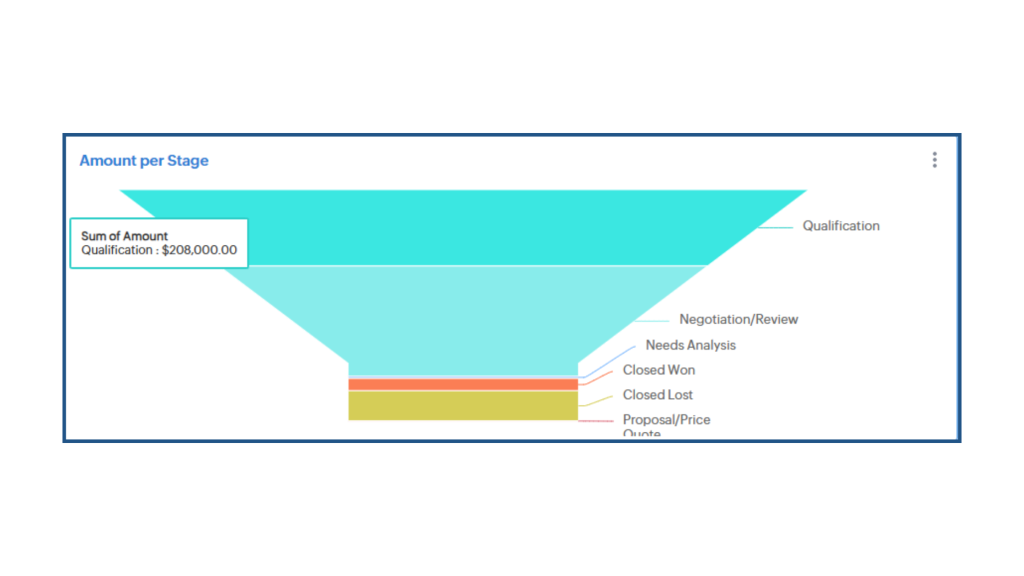
This chart will show you, at a glance, how much amount is in each stage—from “Qualification” to “Closed Won.”
What Should You Track?
Not sure what to include in your dashboard? Here are a few ideas:
Sales Pipeline Health
Use a funnel chart or bar graph to track deals by stage so you can spot bottlenecks.
Email Engagement
Add charts showing email open and click-through rates.
Lead Source Breakdown
Use a pie chart to see which sources bring in the most qualified leads.
Team Performance KPIs
Set up a ranking KPI to track top reps by revenue, calls made, or deals closed.
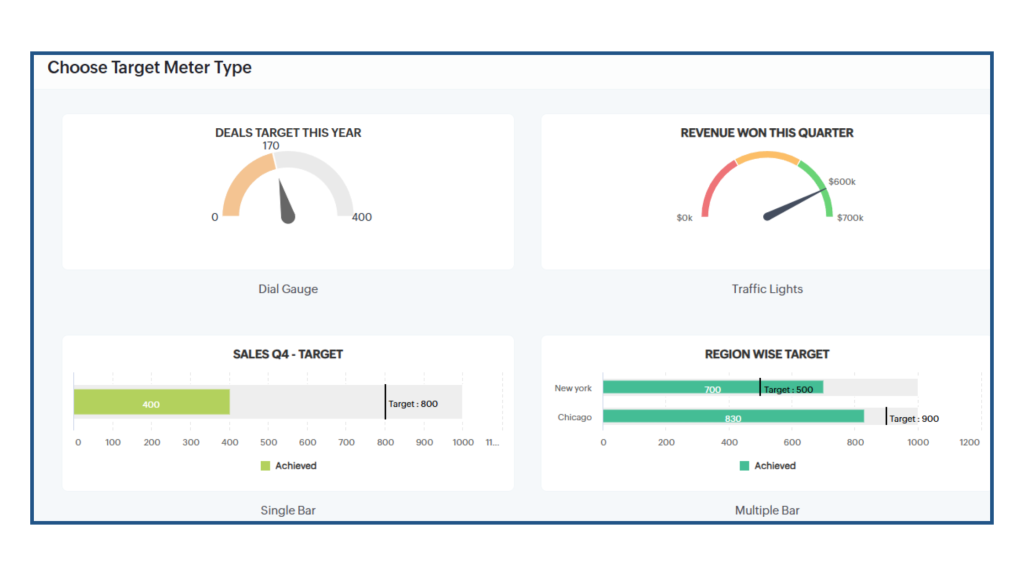
Target Meters
Use dial gauges or traffic lights to measure how close your team is to hitting monthly targets.
Activity Stats
Track tasks completed, calls made, and follow-ups scheduled.
With drill-downs available for all chart types, you can click any data point to dig deeper without ever leaving your dashboard.
The Bottom Line: Dashboards Help You Move Smarter
Bigin’s dashboard helps you move from guessing to knowing. And when you know what’s really going on in your business, you can make better decisions, faster.
Whether you’re tracking team goals or spotting new opportunities, Bigin puts the right info in front of you. It’s built for small businesses who want big-picture visibility without the bulk of a complicated CRM.
If you have any Bigin-related questions, you can book a free demo with our team—we’re happy to walk you through it.
If you haven’t used Bigin yet, you can get started with a 15-day free trial and explore everything the dashboard can do for your business.